🔄 From Problem to Product
🎯 Why combine them?
Continuous improvement teams often face two failure modes: a great root-cause analysis that never ships, or fast delivery that solves the wrong problem. This framework links the two. DMAIC decides what to fix using data and root causes. Agile decides how to deliver it, in small, tested pieces users can see every sprint.
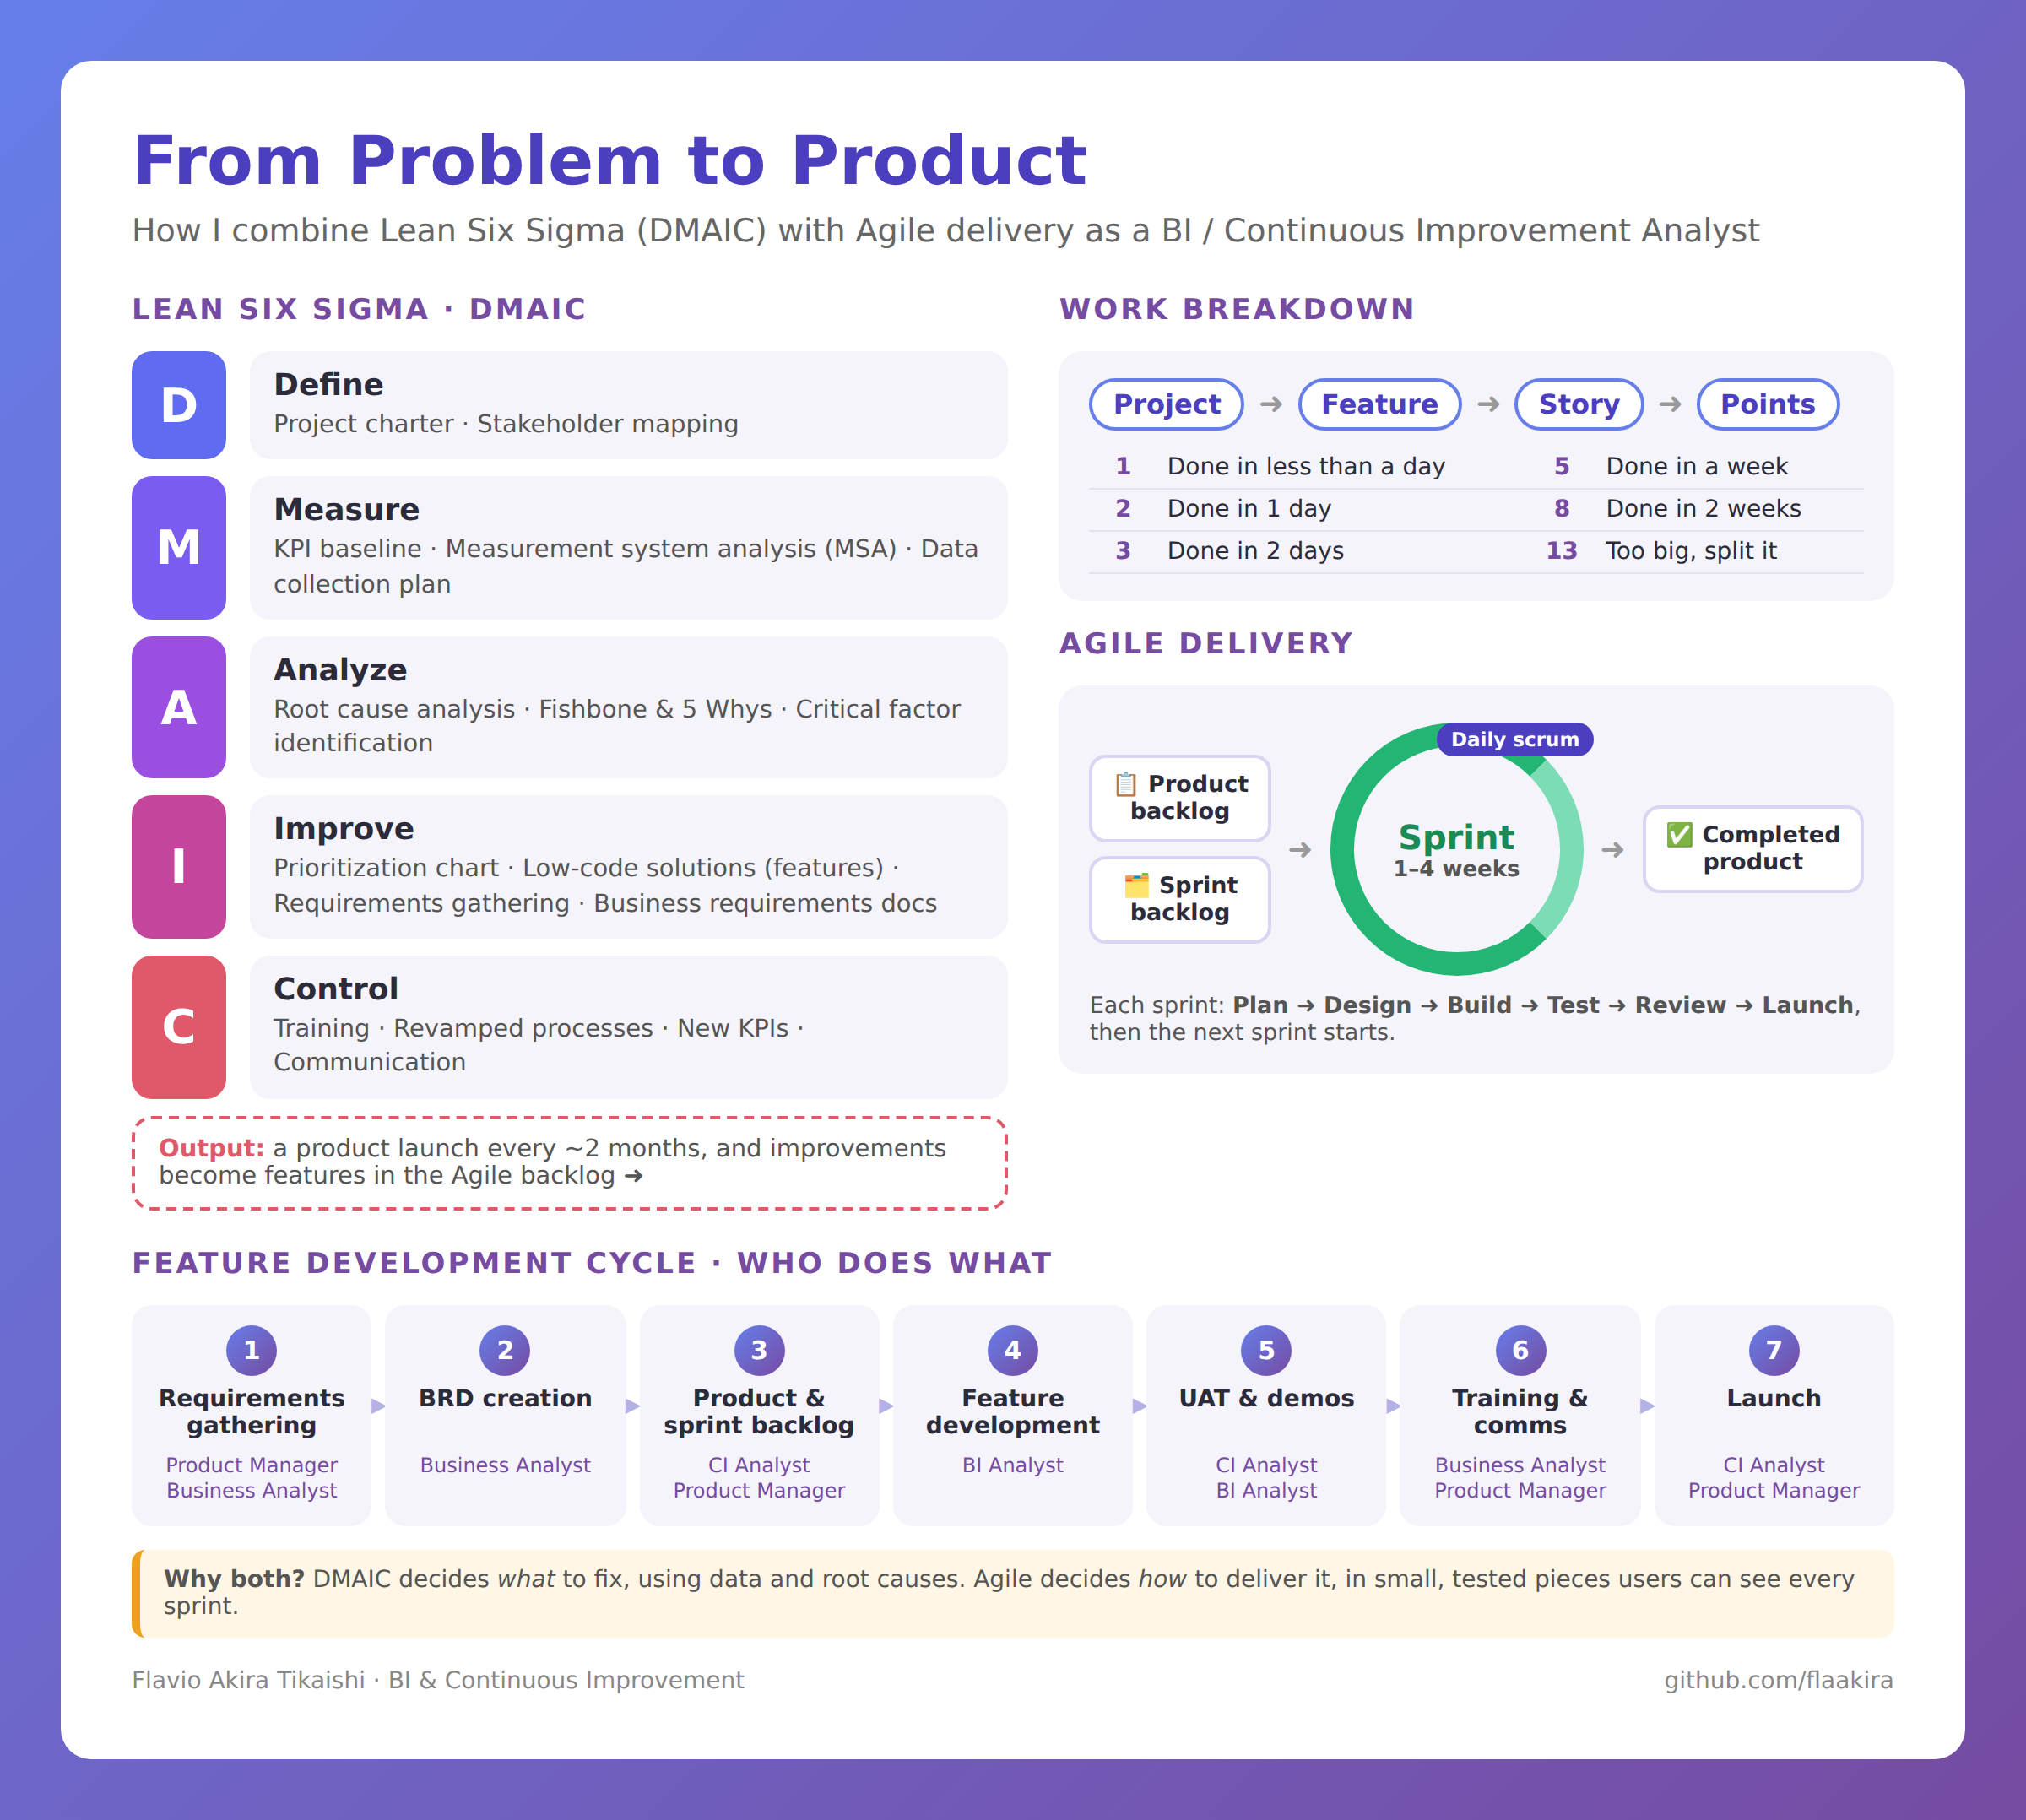
📐 Lean Six Sigma · DMAIC
Click a phase to see its key question, tools and deliverables.
🧱 Work Breakdown & Story Points
| Points | Meaning |
|---|
Stories estimated at 13 points are split before they enter a sprint, so every sprint item can finish in two weeks or less.
🏃 Agile Delivery
📄 Templates: Sprint planning, daily scrum, review & retro · User story & story points
🚀 Feature Development Cycle
Every feature follows the same seven steps. Click a step to see what happens there.
Who is involved in each step
🧪 Illustrative Example
A hypothetical walk-through to show how the pieces connect. The numbers are made up for illustration.
- Define: "18% of purchase requests are submitted with missing information, which delays approvals by days." Charter signed, stakeholders mapped (requesters, procurement, finance, approvers).
- Measure: "incomplete request" KPI defined (any request sent back for missing data). MSA shows two approvers log rejections differently, so the definition is fixed before taking the baseline.
- Analyze: fishbone + 5 Whys point to a free-text email request with no required fields. A Pareto chart shows 3 missing fields cause most rejections.
- Improve: the prioritization chart picks a low-code request form with required fields and lookups (high impact, low effort). It becomes a feature with 6 stories (2–5 points each) delivered in two sprints.
- Control: requesters trained, the email process retired, and the incomplete-request KPI added to the weekly dashboard with an alert above 5%. The feature ships in the next release.